


It's Time to Start Having Confidence in MLB Teams' Records
History says current win-loss records and standings should start aligning closely with what we can expect at the end of the season.


Back on May 1st, I wrote an article questioning if the standings after one month of the regular season foreshadow anything. Ultimately, I concluded that while there is some value in what the standings say, trying to predict a team's exact end-of-season record or run differential based on their winning percentage, Pythagorean winning percentage, and/or run differential after one month does not yield great results. Most teams have now played around 80 games (give or take), and it’s time we start giving a bit more credence to what the standings and win-loss records are telling us. Based on historical data, we are reaching a point in the season where final records and standings should align fairly closely with what we currently see.
In examining the records of each team at each game number in full seasons since 2018, we see that around game number 81-85 teams’ records begin to vary little from their end of season record.1 The chart below shows the percent of teams over that 5-year span with an in-season record statistically different from their end-of-season record at each game number.2
After 85 games, no team at any point had a significantly different record in-season than that which they ended with. We also see the 95% confidence interval for the difference in expected win total (based on in-season winning percentage) begin to really narrow.3
Essentially, this is saying that we can expect a team at game 85 to be within 6.8 wins of what their win percentage would indicate. For example, 95 out of 100 times, a team with a winning percentage of .500 at game 85 would be expected to win between 77.6 and 84.4 games when all is said and done. Compare this to when we last touched on this topic on May 1st, when most teams had played just around 30 games. At that point, the upper bound of the confidence interval was 18.6. A .500 team on May 1st could only be confidently expected to end up winning somewhere in the range of 71.7 to 90.3 games. That could be the difference between a division winner and basement-dweller! The average difference between expected and actual end-of-season win total drops dramatically around this point in the season as well. In fact, once we get to game 90, we can expect a team to finish within 5 wins of what their winning percentage predicts.
What do things look like today?
Based on team records and standings as of this morning (June 25th), below is what we should expect using this 95% confidence interval. I compare this to the current records of teams and what their record “should” be if their winning percentage holds through the rest of the season. I also apply the corresponding ranges to “Games Back” (or games ahead, indicated by ‘+’ games back, for division leaders), to show how confident we can be in a team’s chances to win their division.
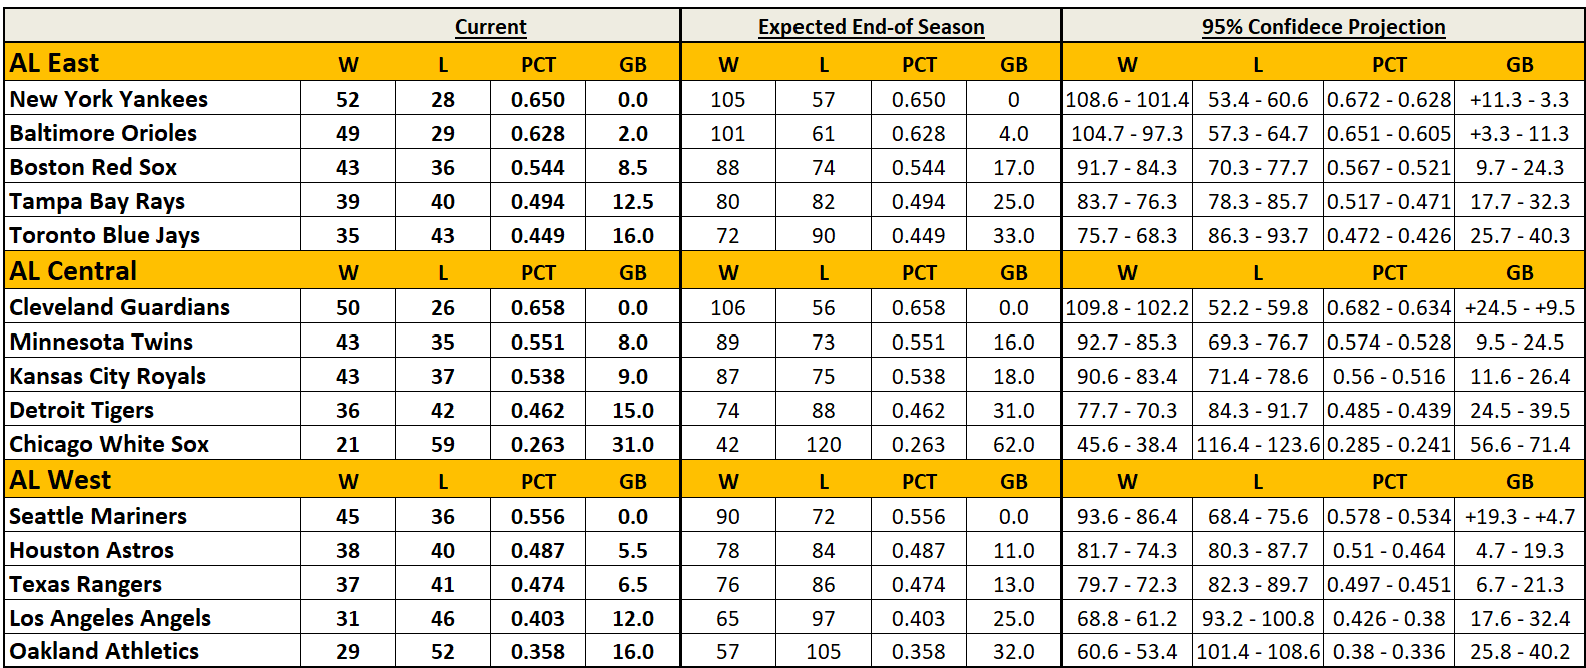

As the trade deadline approaches, this helps clear up the picture a bit on what teams are contenders, and should be buyers at the deadline, and what teams may want to sell off and look ahead to the future. I’ll keep these projections updated fairly regularly in the “Models and Predictions” tab on my Substack page. So should this go completely off the rails by October, I give you all full permission to heckle me as much as you want.
The 2020 season was excluded given only 60 regular season games were played. Game 161 was considered to be the team’s “final” record, as in some years a few teams did not play a game 162. Additionally, game 162 may be unreliable given most teams are already in or out of the post-season and may not play at their true ability or with their typical roster.
Using a one-sample z-test for proportions, with the assumption that the team’s end-of-season record is the “true” proportion.
One-tailed confidence interval measuring if the difference is greater than 0.
Hi Grant, thanks for your comment and interest in my article! I see what you are getting at, but the whole point of this research was to look solely at how the standings shift (or rather, remain the same) from the mid-way point of the season to the end, independent of any external factors. Additionally, I hear a lot about the Phillies “soft” schedule, but frankly I’m not buying much into it. The Phillies actually have the exact same record agains teams above .500 as the Dodgers (15-9), and being the team with the best record in baseball, they will naturally play fewer games against teams over .500. There is also an uncharacteristically high number of sub-.500 teams across baseball, due in part to teams like the Phillies, Dodgers, Orioles, Yankees and Guardians being so dominant. So more games overall are played against sub-.500 teams (this was even more true at the time I wrote this…apologies for the delayed reply)
I previously noted this observation on Neil Paine's Substack, but I'll reiterate it here. The Phillies appear to me to have one of the softest schedules for the first 3 months of the season that I've ever seen in 55 years of watching baseball.
Today they were in Detroit for an allegedly "tough" inter-League tilt on the road. AL games on their plate have also included the White Sox, Angels and Blue Jays. Now, they did play Boston and Baltimore as well...but dropped those series.
Of course, they have a big four games series against Miami coming up next - at home. That'll battle test 'em.
I could be wrong, but I continue to feel that their schedule is an outlier for which historical references might not easily apply. Beyond that, they have played 43 at home; only 36 on the road thus far. At home they are 31-12, but on the road a more pedestrian 21-15.
Strength of schedule has to matter at some point. FanGraphs has them barely over .500 for the remainder - 46 and 38 - for a total of 98 wins - If I am interpreting their projections correctly. That feels about right to me.
Philadelphia could get 100 wins, but I'm not so sure as July hits...I'm more certain that their record, whatever it is at the end, will overstate their actual strength if they face LA or another solid competitor in the Postseason.
I would be interested in your thoughts as to SoS and possible reversion over the next 3 months. Thanks.