


The Anatomy of the Upset Victim
PLUS: Teams you may want to think twice about picking when filling out your bracket


Earlier this week, I did a deep dive into the teams that have what it takes to cause a big (4+ seed difference) upset in the NCAA tournament, and what teams to watch out for in 2025. You can read that post here:

Now, let’s flip the focus and look at the other side; the teams who have fallen victim to a big upset and those at risk this year. We get these every year, and with the increasing parity in college basketball, likely stemming from the rise of NIL and the transfer portal, highly seeded teams feel—or at least should feel—less safe in the early tournament rounds. We have seen an increasing number of upsets in recent years, with the rolling averages of 3+, 4+, and 5+ seed-line upsets gradually rising since 2008.
Not only are there more upsets, but fewer highly seeded teams are making it all the way to the Final Four. Although some years are more wacky than others, since the early 1990’s we have seen, on average, a steady rise in the “sum of the seeds” to make the Final Four.1
What Makes A Team Vulnerable to a Big Upset?
First, let me re-state that I am defining a “big upset” here as a team beating an opponent at least 4 seed-lines higher (i.e., an 8 seed vs. a 4 seed or 15 seed vs. a 2 seed). Beginning with a set of over 50 stats from various sources such as KenPom, Bart Torvik, and TeamRankings.com, I used the Boruta feature selection algorithm to determine the stats/numbers most important to a higher seeded favorite falling victim to a “big upset”.2 The observations in the data consisted of every instance a team beat a team seeded 4+ spots higher in the NCAA tournament from 2008-2024. Boruta functions as a wrapper algorithm around a Random Forest process. It works by first adding randomness to the data through shadow features — shuffled copies of all variables. Then, it trains a random forest classifier on the extended data set and applies the importance measure, Mean Decrease in Accuracy, to evaluate the each feature’s importance. At each iteration, it checks if a real feature has a greater importance than its best shadow feature, removing features determined highly unimportant. The algorithm stops either when all features get confirmed/rejected, or it reaches the defined maximum iterations. This algorithm is ideal for high dimensional data sets (data sets with many variables relative to the number of observations) such as this one. The algorithm gave us the 11 most important statistics of a team which loses to an opponent seeded 4+ seed-lines lower. The importance scores are scaled to sum to 100% for ease of interpretation.
Many of these statistics are simply qualities shared among good teams, like a high KenPom efficiency rating, more Wins Above Bubble3, or similar NET rankings, and are largely inherently correlated. One that stuck out was opponent defensive rebounding rate. This leads us to believe that an underdog that excels in defensive rebounding might be an upset candidate, especially if their opponent struggles on the glass.
The Most Typical Winning Underdogs & 2025 Tournament Upset Candidates
To identify the teams which have most resembled a typical “big upset” loser, I ran a K-Means classification algorithm using the same data as above with the factors deemed important as the variables. I also included all 2025 teams to see who we might anticipate being upset this year. This produced the Euclidean Distances between each losing “big favorite” and the “Average Losing Underdog” from 2008-2024.4 From here, we can see the teams which most resembled—and currently resemble—an upset candidate.
This year’s Mississippi State Bulldogs came in at 4th overall and top among 2025 teams. CBS’s Jerry Palm lists Mississippi State as a projected 6-seed as of March 5th. Arizona’s 2016 squad, who lost to 11-seed Wichita State as a 6-seed, topped the charts overall. For those of you tempted to pick Duke or Houston to be upset this year, I’d urge you to think twice. The Blue Devils and Cougars come in as the 77th and 53rd most similar teams to an average “big upset loser”, respectively. Below is a look at this year’s top upset candidates, along with the teams they are most similar to from the past.
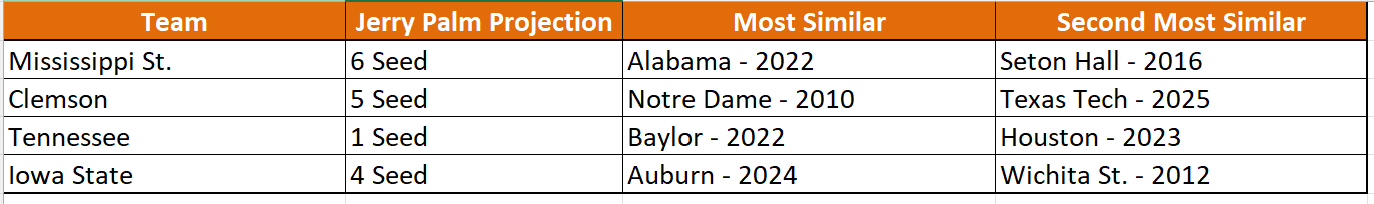
Now, I am by no means predicting these teams to be upset, but if they do, I’ll definitely be a bit less surprised.
Get ready for the madness…
Calculated by adding up the seeds of each Final Four team (i.e., if two 1-seeds, a 3-seed, and a 5-seed make the Final Four, the “sum of seeds” would be 10)
The stats were pulled from the March Madness dataset on Kaggle
“Average Losing Favorite” being a team with the average values for all statistics among the upset losers in the dataset.