MLB Mid-Season Review: The Outperformers and Underperformers
Examining first-half performances of teams and players relative to expectations
As teams begin to embark on the back half of their 162-game slate, I wanted to take a moment to look at which players and teams have overperformed or underperformed relative to their pre-season projections. Every year, FanGraphs releases their "ZiPS” projections; a purely data-based system for both individual and team stats. ZiPS uses multi-year statistics, weighting recent seasons more heavily, and derived projection stats (zStats) while adjusting for factors such as ballpark, league, and quality of competition to establish baseline projections of numerous stats for players and teams. It then compares these baselines to individual season baselines of all players in its database (nearly 140,000 pitcher seasons and 170,000 hitter seasons).1
Baseball Prospectus has also developed its own projection system known as PECOTA, a “backronym” for former Major Leaguer Bill Pecota. The "Player Empirical Comparison and Optimization Test Algorithm" was developed by one of my all-time favorite statisticians,
, in 2003. Silver ran the projections, which were owned by Baseball Prospectus, from 2003-2009, before handing over full responsibility of the system to BP. Widely viewed as one of the most accurate projection systems in the industry, PECOTA projections can be applied to entire teams to forecast win-loss records. It uses projected depth charts to predict runs for and against each team, thereby establishing a projected win total.2Halfway through the season, we can identify several players and teams who are either significantly exceeding or falling short of expectations per ZiPS and PECOTA projections. First let’s look at the players, starting with the pitchers.
The Pitchers
Below is a chart plotting Pitchers’ pre-season projected WAR from 2024 ZiPS projections against what they are currently on pace for, based on current WAR totals and FanGraphs projected playing through the end of the season. The diagonal line represents perfect alignment with pre-season projections (i.e., no difference between projected and “on-pace”).
Garret Crochet of the Chicago White Sox (although a new jersey may be in his near future) is blowing past expectations. So, it is no surprise it is essentially a lock that his pitiful Chicago White Sox will deal him away before the July 30th trade deadline. Phillies ace Aaron Nola was supposed to be the best pitcher in the league by WAR, but has failed to live up to that lofty expectation. Fortunately, teammates Ranger Suarez and Cristopher Sanchez have picked up the slack, ranking among the biggest outperformers.
The Batters
If you’ve paid attention at all to my MVP predictive model, you will know I have been high on the superb seasons of Aaron Judge, Gunnar Henderson, Juan Soto, Shohei Ohtani and Bobby Witt Jr. We all knew these guys were solid players and among the league’s best, but few foresaw this level of production.
On the other end of the spectrum, recent Rookies of the Year Corbin Carrol (2023) and Julio Rodriguez (2022) are falling quite short of the lofty expectations they set when the broke into the big leagues.
The Teams
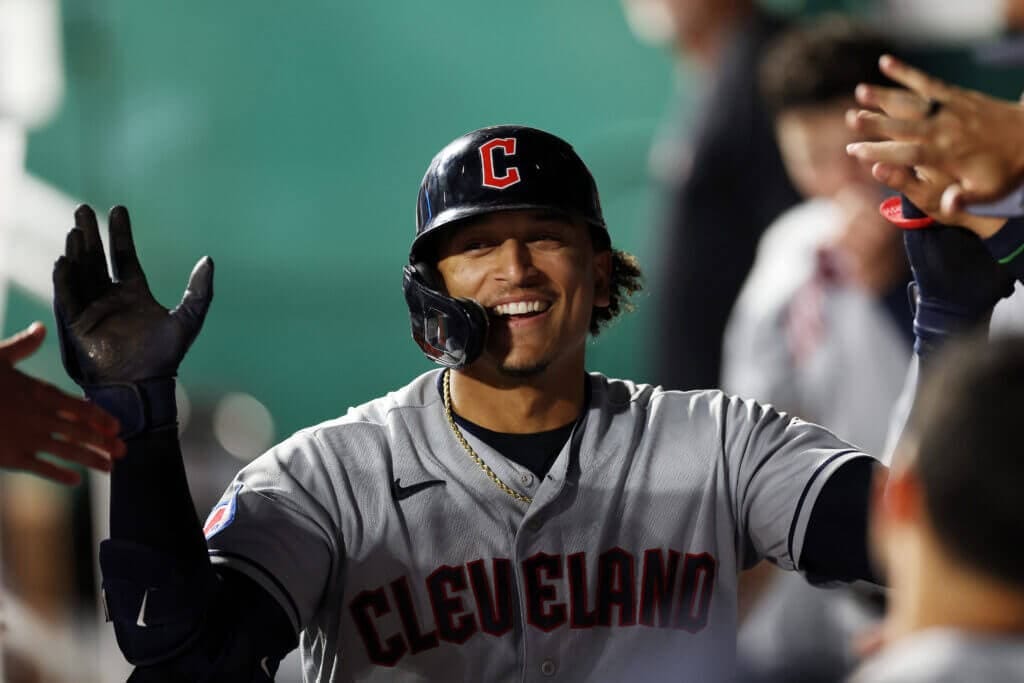
In terms of projected win totals, we see the Guardians, Phillies and Orioles blowing past expectations. The Washington Nationals were expected to be one of the worst teams in baseball, however they are currently on pace to beat their projections by 17 wins. The Phillies and Guardians are both on pace to surpass their win-total projections by at least 20 wins. The biggest net-underperformer has been the Chicago White Sox, who are on pace to win 21 fewer games than projected.
Based on a one-sample t-test for proportions, assuming projected record as the baseline, there are currently six teams with a significantly different winning percentage at this point in the season compared to what they were projected for. These teams are the Phillies, Nationals, Royals, Guardians, White Sox and Marlins. Another interesting observation is the number of teams currently on pace (or near on pace) to exceed 100 wins. The Guardians, Phillies, Orioles, and Yankees are all on pace to hit triple digits in the win column, with the Dodgers on pace for 99. Never before in the Major Leagues have five teams surpassed 100 wins. With four teams also on pace to win fewer than 60 games, are we living in an age of historically low parity across the sport? Just like some of the player projections, it wouldn’t be shocking to see some regression to the mean during the back-half of the season, but if the findings in my recent article on the reliability of mid-year win-loss records comes to fruition, we shouldn’t see things change too much. Either way, these on-pace-verses-projected statistics give us something to watch as the season progresses, and puts into context the players and teams who are really exceeding (or trailing) pre-season expectations.


