MLB Mid-Season Review
Recapping the first half and previewing the second half of the 2025 season
It feels like just yesterday that Shohei Ohtani donned Dodger blue for the first time and took the field in Tokyo, kicking off the 2025 season. Believe it or not, most teams have, or are about to, play their 81st game of a 162-game campaign, effectively marking the halfway point of the Major League Baseball season.
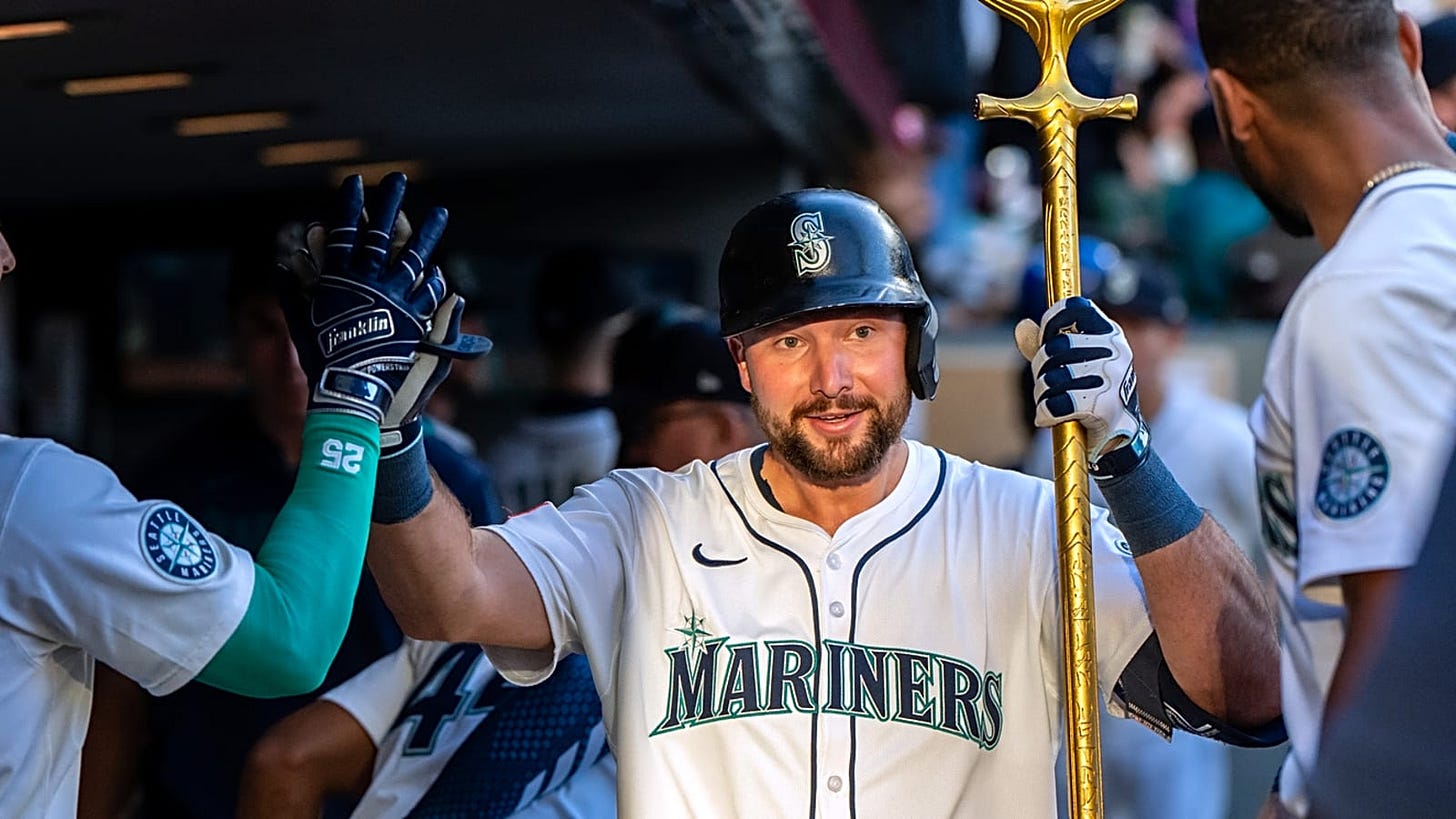
A lot has happened in the past three months. We watched Aaron Judge explode at the plate, putting together one of the most dominant offensive starts to a season in baseball history. But Mariners catcher Cal Raleigh isn’t letting Judge coast to the MVP, as he’s assembling one of the best offensive seasons ever by a catcher.
The Rockies stumbled to an unprecedented 9-50 record through 59 games, becoming the fastest team in over 140 years to 50 losses while seemingly saying, “Hold my beer” to last season’s historically awful White Sox team.1 On the other end of the spectrum, the Detroit Tigers and Cy Young frontrunner Tarik Skubal have roared to the best record in baseball, outperforming even the star-studded reigning World Champion Dodgers, who many predicted could be among the greatest teams of all time.
One of the most beautiful aspects of baseball is its unpredictability. From breakout stars and shocking slumps to unforeseen contenders and unimaginable collapses, the game never fails to surprise. In this post, we’ll dive into the players and teams that have overperformed and underperformed expectations, before wrapping up with a look ahead to the remainder of the season.
Player Performance vs. Expectations
Many of you are aware of the fantastic and incredibly detailed pre-season projections of Dan Szymborski of FanGrahs. Dan’s ZiPS projections are the industry standard for forecasting player performance. However, no matter how statistically sound and meticulous, baseball is hard to predict. To examine players most over or underperforming expectations, I compared current WAR and wRC+ to what was projected in the FanGraphs ZiPS projection.2 Note that current WAR is projected out to the full season based on what the player is on pace for currently.
Cal Raleigh has been, unsurprisingly, the biggest surprise to the upside among position players. He is on track to surpass his FanGraphs WAR projection by nearly 6 points, more than doubling the 5.1 WAR he was projected for. Raleigh has already made history becoming the first catcher to hit 20 home runs before June 1st. Atlanta outfielder Michael Harris III has been the biggest disappointment, lagging both his WAR and wRC+ projections more than any other qualified player thus far.
I did the same for pitchers, this time looking at WAR and ERA.
Kris Bubic has been a key piece in the Royals’ quest to stay alive in the wide-open AL Wild Card race, particularly given how the Royals have played thus far. The Royals rely more heavily on their pitching than any other club. Kansas City ranks second-to-last in MLB in runs scored, but second in fewest runs allowed. It is without a doubt that K.C. wouldn’t still be in the playoff race if it weren’t for overperformances by their pitchers, particularly Bubic and Wacha, who combined are on pace for 7.0 more WAR and a combined ERA 2.72-points below what FanGraphs projected.
Team Performance vs. Expectations
FanGraphs also has preseason win projections for each team. Similarly, I developed my own preseason projections, which you can refer back to and read more about in my MLB season preview article. To assess how each team is performing relative to expectations, I’ve compared current team records to their preseason projections from both FanGraphs and my model.
Not to toot my own horn, but I do want to mention that my preseason projections have performed ever-so-slightly better than FanGraphs, with the win difference from my model having a standard deviation of 10.0 compared to FanGraphs’ 10.1.
The Tigers have blown away expectations, winning 17 more games than FanGraphs projected and 20 more than my model. While the Rockies may have underperformed expectations the most, they were still expected to be a very bad team. I think the Braves and Orioles should be considered the greatest underperformers, given they were both expected not only to be winning teams, but viable contenders in their league.
In the same way I developed my preseason win projections, I ran a Monte Carlo simulation to forecast the remainder of the regular season to get projected win totals for each team. In doing so, I was able to attain each team’s probability of winning their division and making the playoffs. The results, based on 10,000 simulations of the remainder of the season, are below.
The Tigers may be on top right now, but the Dodgers are still projected to have the best record, followed by the Cubs. As discussed in las week’s “Weekly Windup”, the Rays have arrived and have sneakily crept up on the mighty Yankees. Our model now gives the Rays the best odds to win the AL East, at 57%, with the Yankees odds at just 35%.
We’ve had a fun first half, filled with many exciting and unexpected storylines by both players and teams. It is fun to make some predictions about the rest of the season, but I think the most reliable prediction I can make is that we are in store for even more twists and turns and surprises before game 162, because, in the words of the great John Sterling, “That’s baseball, Susan”.
The 1884 Kansas City Unicorns and 1876 Cincinnati Red Stockings are tied for the all-time record, each starting out 7-50.
As a refresher, per MLB.com: “wRC+ takes the statistic Runs Created and adjusts that number to account for important external factors -- like ballpark or era. It's adjusted, so a wRC+ of 100 is league average and 150 would be 50 percent above league average.”


