How Much Do the Standings on May 1st Really Matter?
Does one month foreshadow the rest of the season?

The calendar has turned to May, which means we have one full month of the MLB season in the books (plus a handful of March games). Here are the current standings as of yesterday, May 1st:
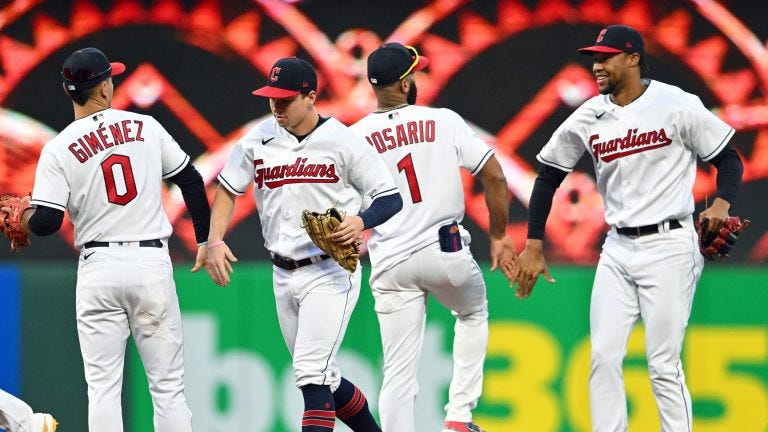
Does this even matter? The MLB season is 162 games long, and the majority of teams have played around 29 games; just under 18% of their season. When framed in the context of other leagues, this is equivalent to almost exactly 3 NFL games, 14.5 NBA games, and just under 2.25 college football games. Baseball fans are notoriously prone to being fooled by small samples. Think about announcers lamenting over a batter going 0 for his last 15 - a miniscule sample of at-bats compared to the 500+ that most regulars get. The same goes for judging teams. So often, fans write-off a team that gets off to an ice-cold start to the season, regardless of their pre-season expectations. Take this year’s Astros for example. On the flip side, many are tempted to fall for those teams wildly over-achieving and off to a scorching-hot first month (*cough* Cleveland Guardians *cough*). Are their judgements valid, or are they yet again falling victim to #SmallSampleSize?
To research this, I looked back at the past 20 seasons of Major League Baseball, from 2004-2023 (excluding the pandemic-shortened 2020 season1). I examined each team’s winning percentage, run differential (runs scored - runs allowed), Pythagorean winning percentage2, and place in their league standings on May 1st compared to at the end of the season. Using a paired samples t-test, I found that a team’s winning percentage on May 1st was not significantly different than their winning percentage at the conclusion of the season, with a sky-high p-value of 0.9223. This means there is absolutely no statistical evidence to suggest a team’s record at the end of the season will be much different than their record on May 1st. Pythagorean winning percentage, developed by famed baseball statistician Bill James, attempts to determine how many games that a team should have won based upon their number of runs scored versus runs allowed. It would be logical to think this could serve as a better predictor of end-of-season record. A paired t-test comparing May 1st Pythagorean win percentage against end-of-season win percentage was also not significant, with a p-value over 0.85. The average absolute difference between a team’s May 1st Pythagorean percentage and end-of-season actual winning percentage was 0.069. For example, this translates to a May 1st Pythagorean winning percentage of, say, 0.465 versus an end-of-season winning percentage of 0.534. Not tremendous, but not bad for just a month’s worth of games!
Run Differential
As we discussed, Pythagorean win percentage takes into account runs scored versus runs allowed. How does the raw run differential itself on May 1st compare to that at the end of the season?
Of the early season and end-of-season metrics I have discussed, May 1st Run differential is the most strongly correlated to end-of-season results. It has a correlation coefficient of 0.583 with end-of-season winning percentage, and 0.62 with end-of season run differential. Beating out (just barely) James’ Pythagorean win percentage, which has a correlation with end-of-season winning percentage of 0.584. These coefficient values are good, but not overwhelmingly strong. It appears Bill James was on to something with his Pythagorean metric, but the straight-up raw run differential may still be a slightly better indicator of future performance.
The Best and the Worst
What teams have taken a major turn, for better or worse, from May through the rest of the season?
The Cincinnati Reds went back-to-back in 2021 and 2022 in following up a horrible April with a much-improved rest of the season.
The Orioles and Dodgers were on fire the first month of 2005 and looked to be on a collision course to meet in October. Alas, both teams finished below .500 and missed the playoffs.
Can We Predict End of Season Results?
Being the stats nerd I am, I did in fact try running several linear regression models using various sets of these metrics as predictors. While all came out to be significant predictors on their own, ultimately the predictive accuracy and model fit (the degree of variance in the outcome variable captured by the predictor variables in the model) was not great. When trying to predict end-of-season winning percentage, some of the better models were only coming slightly within +/- 4 wins. To put that into perspective, that is the difference between a team going 90-72 and 82-80, quite a wide margin by any standards. Maybe if I were to add more predictive variables and/or test different algorithms I could come a bit closer, but ultimately baseball has so many moving parts, and so much can happen throughout the course of a 162-game season, that highly accurate baseball forecasts are near impossible (and a countless number of people have tried!).
Conclusion
So, what can we gather from all of this? There is absolutely some value in looking at a team’s early season/first month records when trying to gauge how they will finish the season. There appears to be no statistically significant difference between a team’s May 1st winning percentage and end of season winning percentage, nor their May 1st run differential and that at the end of their season. However, trying to predict a team's exact end-of-season record or run differential based on one month’s worth of winning percentage, Pythagorean winning percentage, and/or run differential does not yield great results. May 1st standings and team performance matter, but should be viewed as more of a guide to what we can expect and not a flat-out predictor of the ultimate end-of-season results.
2020 featured a 60-game slate beginning July 23rd.
Also known as “expected winning percentage”.
A p-value less than 0.05 is considered significant at the 95% confidence level (which is the most common level).


