


Does the Home Run Derby Actually Mess Up Your Swing?
A valid concern, or a lame excuse?


One of the most popular yet controversial excuses players cite for not wanting to participate in the MLB Home Run Derby is that they fear it will hurt their swing. Fans want to see the best home run hitters showcase their power on the eve of the All-Star Game, and rightfully so. I mean, wouldn’t you rather see Aaron Judge and Bryce Harper, two of the best home run hitters of our generation, instead of (no offense, considering that he performed surprisingly well last night) a guy like Alec Bohm, whose 11 homers is currently tied for 90th in Baseball? This year’s field appeared particularly watered-down, with just five of the top-25 home run leaders this year taking the stage. Is this fear that the event will mess-up swings justified, or just a lame excuse for a day off?
Comparing Participants Before vs. After the Derby
I wanted to compare how batters who participated in the derby performed before the All-Star Break versus after. Over the past 10 Derbys from 2013-2023 (there was no derby in 2020), we tend to see decline in both home run rates (as measured by home runs per 162 games) and OPS for qualified batters1 who participated in the Home Run Derby. This decline is fairly substantial in some cases.
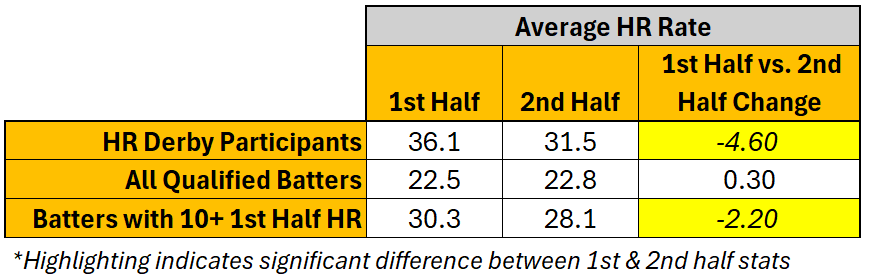
Overall, batters who participate in the home run derby see their home run rates drop, on average, by 4.6 homers per 162 games from the first half to the second half of the season - falling from 36.1 in the first half to 31.5 after the All-Star break. A two-sample t-test finds this difference to be statistically significant at a 99% confidence level. This trend is even more interesting when we see that, among all MLB batters, average home run rates tend to actually increase slightly, from 22.5 in the first half to 22.8 in the second half. This difference is not statistically different. In terms of OPS, the average derby participant has hit for an OPS of 0.873 in the first half, and followed it up with a 0.834 OPS after the break. This is also significantly different at the 99% confidence level. When all MLB batters are considered, the average first-half OPS is 0.782, and then drops slightly to 0.779 in the second half. This change is not significantly different. On the surface, it may appear as though participating in the Home Run Derby has a negative effect on hitters. What needs to be considered though, is that those in the Home Run Derby are not your typical player - they are, by nature of the event, all-star talents.
Among Their Peers
If we only consider players who have hit at least 10 home runs in the first half of the season, prior to the Home Run Derby, a different story emerges. Batters with 10+ homers prior to the All-Star Break have an average HR rate of 30.3 HR/162 in the first half. After the break this drops to 28.1. While not quite as extreme as the derby participants, his difference is significantly different at the 95% confidence level.
The difference in first half vs. second half OPS for these batters is more in line with the derby participants. Before the “Midsummer Classic”, batters with 10+ homers have an average OPS of 0.828. This then drops to 0.808 in the second half.

The changes between first and second half HR rate and OPS are significantly different when comparing derby participants to all qualified batters, but when comparing more similar batters - those with higher home run totals - the differences are not significant based on a two-sample z-test. The chart below displays the changes in home run rate and OPS from the first half to the second half (pre-Home Run Derby versus post-Home Run Derby) for all qualified batters and batters with 10+ pre-derby home runs compared to derby participants.

Debunking the Myth
We see no statistical evidence to suggest Home Run Derby participants perform any worse after the Home Run Derby in terms of home run rate and OPS when compared to their power-hitting peers. I have a hunch we would see progressively more similar first half vs. second half differences if we were to compare derby participants with even stronger power hitters, such as those with 15+ homers or an OPS over .800. There may be several reasons for this. For one, batters with a high number of first half home runs may be experiencing an unusual hot streak and are destined for some regression back to their career norms. Additionally, the simple law of large numbers states that as a sample size becomes larger, the sample mean gets closer to the expected value. The further into the season, the more likely it is that a player performing exceptionally well will start to slowly fall back towards the average - be it the league average or their career average. We could go down quite a rabbit hole digging into this, but I think this evidence is sufficient. Whatever the exact reason, I’m confident in saying the Home Run Derby does not mess up a player’s swing. So come on guys, grab a bat, get out there and put on a show! Your swing will be just fine.
Minimum 224 plate appearances before the All-Star Break and 189 plate appearances after the break
Yup, it’s effectively the winner’s curse (ie regression to the mean) since derby participants are likely in the upper end of first half HR leaderboard