Clustering World Series Champions
What type of champion are the Dodgers? And what past World Series winning teams are they most similar to?
Congratulations to the 2024 Los Angeles Dodgers! On Wednesday night, the Dodgers stormed back from a 5-0 deficit to win their eighth title in franchise history, besting Yankees in Game 5 at Yankee Stadium. The Dodgers have been a dominant squad all year long. They’ve relied heavily on their offense - including stellar baserunning - while navigating through an injury-plagued pitching staff and less-than-stellar defense.1
How do the Dodgers compare to other World Series champions? I looked back at the past 100 World Series winners - dating back to 1923 (remember, there was no World Series in 1994 due to the labor strike) - and ran a cluster analysis to group World Series champs into distinct groups based on similar characteristics. To do so, I used the K-means algorithm, which is an unsupervised machine learning technique used to identify patterns within data by grouping similar data points together. The goal of this algorithm is to locate data points sharing common characteristics and assign them to the same cluster.2 The data used for this consisted of a number of team-wide stats. These were team winning percentage, K/9 (pitching), BB/9 (pitching), ERA, FIP, Pitching WAR, HR’s, stolen bases, BB% (batting), Slugging %, wOBA, wRC+, Batting WAR, BsR (FanGraphs base running metric), and Def (FanGraph’s defensive metric). In running some preliminary analyses and visualizations, I found five to be an acceptable number of clusters.3 Below are the characteristics of the groupings that resulted from the K-means analysis, and the average stats that corresponded to each.
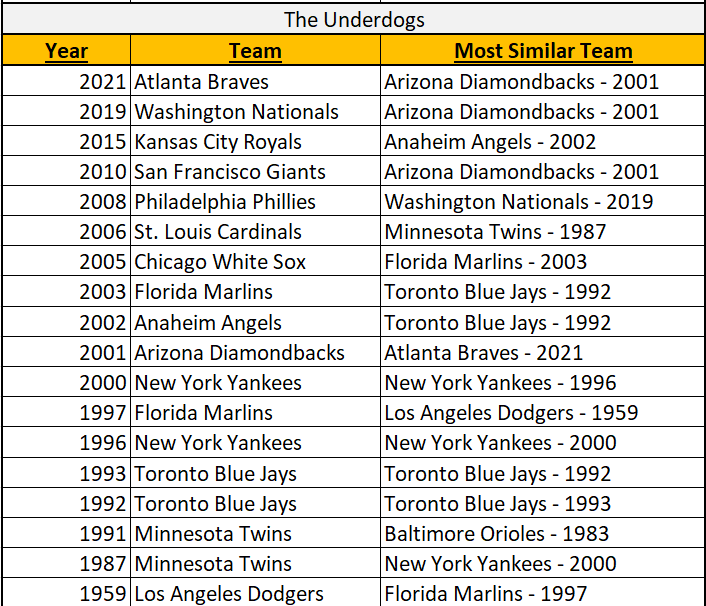
Here is how the groupings shook out, regarding what World Series winners fell into each group.
You may be wondering about the right-most column, “Most Similar Team”. Using the Euclidean distance measure to calculate similarity scores, I found the team most similar to each World Series champion, based on the statistics used in the K-means clustering.4 This measure essentially quantifies how “close” (i.e., similar) a data point (in this case, a team) is to the others. Let’s look at how similar/different other World Series champs are to this year’s Dodgers.
The most similar team, by a fairly substantial amount I may add, is the 2013 Boston Red Sox. It comes as no surprise that teams tend to group together with other teams in the same era, as the game of Baseball has changed (and sometimes, changed back) dramatically throughout the years. If you were wondering, the team least similar to this year’s Dodgers are the 1933 New York Giants. If you are a stats nerd like me, I included the stats of each World Series winning team that went into this analysis below. It is interesting to see how stats have changed and evolved over the years and through different eras.
I found it quite interesting to see how different World Series winners compared to each other, and discover statistical characteristics that defined specific eras in baseball. Congrats again to the Dodgers on a fantastic season! Sadly though, we now must wait a long, cold five months for baseball to come again…sigh.
The Dodgers ranked 4th in MLB in FanGraph’s baserunning statistic (BsR), and 20th in Defensive Runs Above Average (Def), per FanGraphs.
Abd El-Hafeez, Nermeen. “Understaning K-Means Clustering.” Medium, 28 Sept. 2023, https://medium.com/@nerminhafeez2002/understanding-k-means-clustering-3716731cc648. Accessed 29 Oct. 2024.
Specifically, analysis of a scree plot showing the within-cluster sum of squared errors (WCSS) of 1-10 clusters.


I'm not a sports person in the slightest, but I really enjoyed this analysis! Interesting groupings, and I plan to share this with my brother. Nice work!