


Clustering Champs: Past March Madness Winners Most Like the Gators
Plus: This Final Four featured some very similar teams, but we have seen that before.

It’s been almost a week since the Florida Gators cut chomped down the nets in San Antonio. This team is considered one of the most dominant and talented national champions in recent history. They rank as the 2nd-best national champ in the KenPom Era, which dates back to 1997. The top ranked NCAA Tournament champions by KenPom Adjusted Efficiency, are…
2001 Duke (37.32)
2025 Florida (36.46)
2024 Connecticut (36.43)
2008 Kansas (35.21)
2019 Virginia (34.22)
2021 Baylor (33.87)
2018 Villanova (33.76)
2000 Michigan State (33.61)
They were surely a dominant squad, navigating the historically brutal SEC en route to a 36-4 record when all was said and done on Monday evening. Aside from their overall dominance, how closely did this Gators team mirror other recent national champions? To answer this, lets dig into the data.
Clustering National Champions
I ran a K-Means Clustering algorithm on all national champions since 1997 using end-of-season KenPom data. The statistics input were Winning Percentage, Overall Adjusted Efficiency, Adjusted Offensive Efficiency, Adjusted Defensive Efficiency, Adjusted Tempo, Luck, Strength-of-Schedule Adjusted Efficiency, and Non-Conference Strength-of-Schedule Adjusted Efficiency.1 This resulted resulted in five groups (clusters) made up of teams with similar characteristics, strengths, and weaknesses.
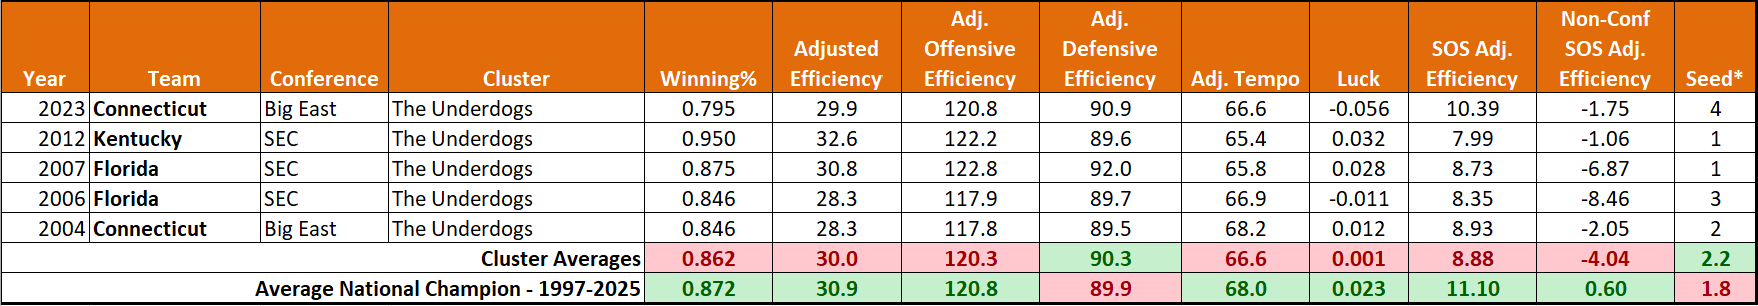
Cluster 1: The Underdogs
Characteristics: Below average record and adjusted efficiency with a poor strength-of-schedule, especially in non-conference. Slightly better on defense than on offense. Average 2-seed+.
Statistics:

The Teams: 2023 Connecticut, 2012 Kentucky, 2007 Florida, 2006 Florida, 2004 Connecticut
Cluster 2: The Runners & Gunners
Characteristics: Fast paced, good offenses with a very tough schedule both overall and out of conference. Teams usually attained a 1-seed.
Stats:

The Teams: 2022 Kansas, 2018 Villanova, 2017 North Carolina, 2016 Villanova, 2009 North Carolina, 2005 North Carolina, 2002 Maryland, 2001 Duke, 1998 Kentucky

Cluster 3: The Dominant D’s
Characteristics: Defense-reliant and play at a slow, methodical pace. Likely a dominant team from a weaker conference given the lower overall SOS but above-average non-con SOS. All of these teams earned 1-seeds.
Stats:

The Teams: 2013 Louisville, 2010 Duke, 2008 Kansas, 2000 Michigan St., 1999 Connecticut

Cluster 4: The Juggernauts
Characteristics: Elite squads. Top in overall adjusted efficiency with an emphasis on offense. Beneficiary of some good luck. Play an overall tough schedule but have a weaker non-con slate, therefore likely top teams from a powerful conference. All were 1-seeds.
Stats:

The Teams: 2025 Florida, 2024 Connecticut, 2021 Baylor, 2019 Virginia, 2015 Duke

Cluster 5: The Bracket-Busters
Characteristics: Cinderella stories. Lowest efficiency metrics across the board and worst record. Had a lot of good luck go their way. Typically play at an average pace. Tend to be a lower seed.
Stats:

The Teams: 2014 Connecticut, 2011 Connecticut, 2003 Syracuse, 1997 Arizona

Most Similar National Champions to Florida
The K-Means algorithm enabled me to see which teams were most similar to this year’s champs. The table below ranks the previous national champions, since 1997, by how similar they are to the Gators in terms of Euclidean Distance. The same metrics that were used in the K-Means model were used to calculate the Euclidean Distance.
The 2021 Baylor Bears had the most similar characteristics to the 2025 Florida squad, with last years champion UConn Huskies a close second. It is apparent that the teams ranking high on this list were some of the more dominant, high-ranking teams in their respective season, a testament to the Gators’ elite 2025 campaign.
Little Diversity in the Final Four
This Final Four featured teams largely quite similar. The table below shows how each team ranked in terms of similarity to each other among the 112 Final Four teams dating back to 1997. You can see that Houston was the least similar of the four, but still the most differentiated pairing—Houston to Auburn—still ranked as Houston’s 40th most similar team and in the top 40% of most similar Final Four teams to the Cougs.

This Final Four was one of the lesser diverse in terms of team characteristics, strengths, and weaknesses, in the past 29 seasons.2 The chart below ranks overall Final Four team similarity, based on the sum of the Euclidean Distance of the four teams in the Final Four.
The 2007 Final Four featured the teams most similar to each other. It is no coincidence that the last Final Four until this year to feature all 1-seeds, 2008, ranks second. Interestingly, last year’s Final Four was in stark contrast, ranking last with the group of teams least similar to each other.
It will be interesting to see how NIL and the transfer portal effect the type of teams that make the Final Four in the coming years. Will more similar teams tend to reach the final weekend, or will we get elite squads featuring totally different strengths, weaknesses, and characteristics? In this ever-changing college basketball landscape, only time will tell.
28 Final Fours…thanks COVIID