Baseball's Surprise Postseason Stars
Sometimes, it's the most unexpected players that shine in October
Last week, we investigated the best playoff teams and franchises, and those which have most exceeded expectations in the postseason. Here, we will look at the players who have outperformed the most in October.
Already in this year’s playoffs, we have seen heros emerge in crucial moments. Mark Vientos has had a coming-out party, going 5-20 with 2 homers and 7 RBIs - most in very crucial moments - for the New York Mets. Vientos leads all players in Win Probability Added (WPA) with 0.88.1 Fernando Tatis Jr. has flashed the leather with some amazing plays in right field while batting a ridiculous .643 with an absurd OPS of 2.151 in a not-too-shabby sample of 18 plate appearances.2 Most recently, Nick Castellanos had yet another heroic postseason performance for the Phillies when he drove in Trea Turner to walk it off on Sunday night at Citizens Bank Park. In the well-over 100-year history of Major League Baseball postseason, we have seen legends be made, and players step up in the limelight. Which players have boosted their performance the most in October?
Batters
I used Weighted Runs Created Plus (wRC+) as my metric of evaluation for batters, as it adjusts for era, run environment, and ballpark, while also putting all batters on the same scale. Looking at players who had at least 800 career plate appearances in the regular season and 50 plate appearances in the postseason throughout their career, I compared their wRC+ in the regular season to what they managed in the postseason.
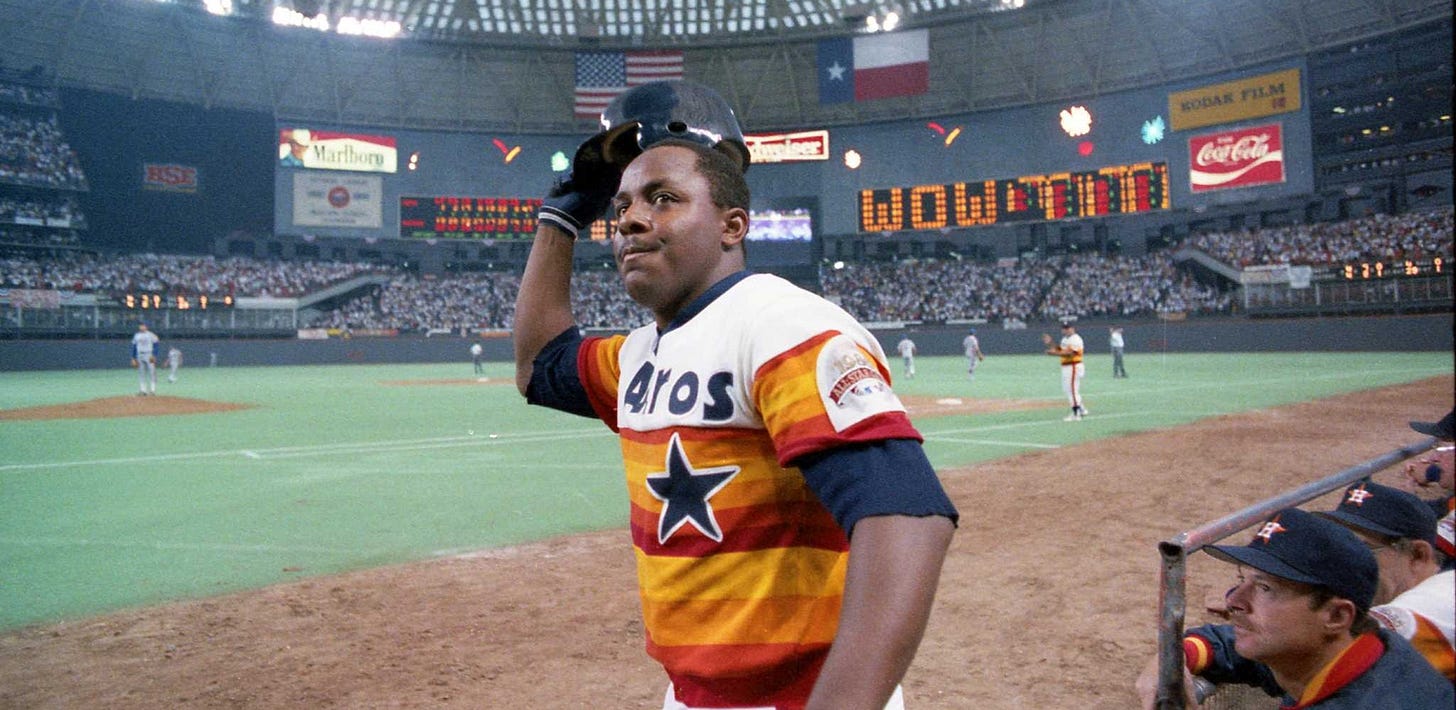
Billy Hatcher, a journeyman outfielder who played for seven teams across his twelve year career, emerged as the player who upped his game the most in the postseason. Hatcher garnered a wRC+ 142% better in the playoffs than the regular season. Funny enough, the man who earned the nickname “Mr. October”, Reggie Jackson, was 207th on the list with a 9.3% improvement in the playoffs versus the regular season.
Pitchers
For pitchers, I used Fielding Independent Pitching (FIP) as the evaluation metric.3 Personally, I believe FIP is the best judge of truly individual pitching performance. It is also what FanGraphs bases their pitching WAR off of.4 Below shows the pitchers with the greatest difference in FIP between the regular season and postseason.
A good chunk of the players in the top-25 listed above are all-time greats. Hall of Famers Hal Newhouser, Sandy Koufax, Old Hoss Radbourn, Nolan Ryan, John Clarkson, Lefty Grove, and Bob Gibson, along with current stud closer Josh Hader, headline this list. Current Atlanta reliever Tyler Matzek, who has split most of his career between the minors and majors and has largely hovered barely above replacement-level while in the big leagues, surprisingly leads the pack.
Win Probability Added
One other aspect I considered was Win Probability Added (WPA) by a player. FanGraphs defines this as “the change in win expectancy from one plate appearance to the next and credits or debits the player based on how much their action increased their team’s odds of winning”.5 It is highly context-dependent, meaning that actions in high-leverage situations effect WPA more than actions in less pivotal game situations. WPA is a cumulative stat, so to account for this I put it in a rate-based “per-game” type of context. For batters, I calculated WPA per 500 plate appearances.
Billy Hatcher again comes out on top. It should be noted that FanGraphs only has WPA stats dating back to 1974, so we can really only consider the past 50 years when analyzing WPA. Billy Hatcher was actually a detractor to his team in the regular season - lowering his teams chance of winning, on average, per plate appearance - but somehow it was a whole different story in the playoffs. For pitchers, I scaled WPA to be per 100 innings pitched.
Tyler Matzek again takes the crown, and by a not-so-narrow margin! Clayton Kershaw, who is undoubtedly one of the best pitchers of our generation but is know to have really struggled in the postseason, ranks 329 out of all qualified pitchers.
What this ultimately shows us is that you never quite know who is going to shine on the big stage of October baseball. It is one of the things that make playoff baseball so exciting. An unknown name can quickly become a hero in the postseason, while all time greats may fail to live up to expectations. Who will be this year’s surprising breakout? The postseason is young, but we already have quite a few candidates….
FanGraphs defines this as “the change in win expectancy from one plate appearance to the next and credits or debits the player based on how much their action increased their team’s odds of winning”. It is highly context-dependent, meaning that actions in high-leverage situations effect WPA more than actions in less pivotal game situations.
Its still an incredibly small sample size, but given its so early in the postseason it’s about the best we can go off of.
Per FanGraphs, FIP estimates a pitcher’s run prevention independent of defense. It is based upon outcomes such as strikeouts, walks, and home runs, which do not involve the defense. FIP approximates what a pitcher’s ERA would be over a given span assuming he had league average results on balls in play and league average timing.


